

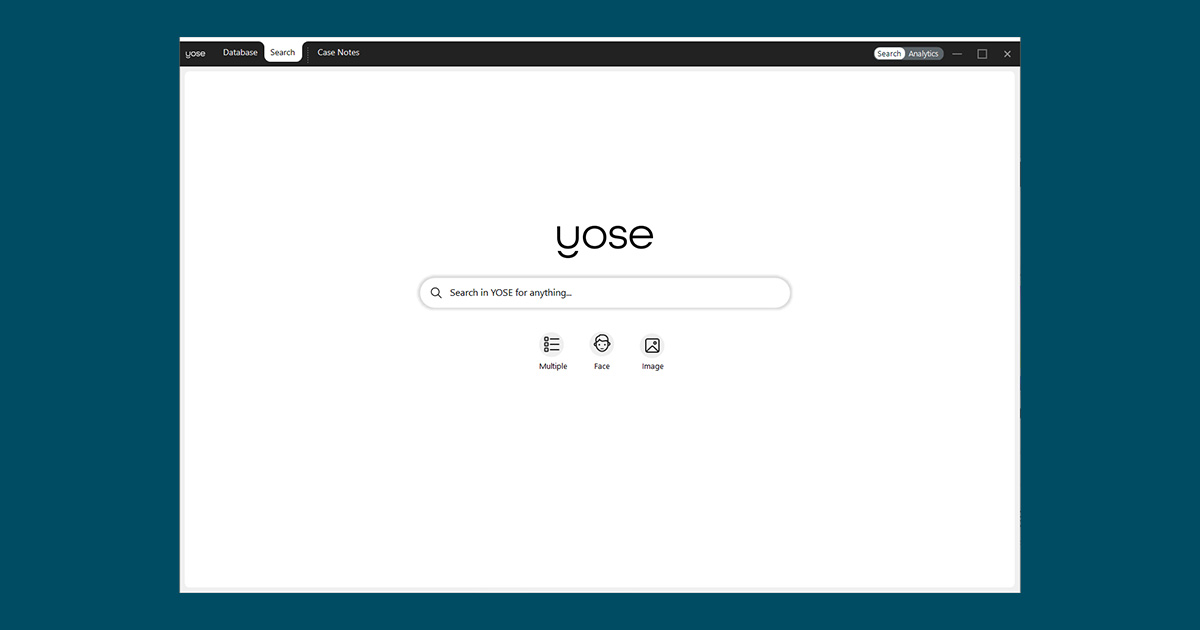
Introducing Search Mode
YOSE is the most powerful search engine in the world. Users can search for anything whether it is visual or textual content, or even faces, visual objects and scenes! We are continuously enhancing the YOSE search engine by adding even more capabilities. Working alongside our partners from across the world, we are ensuring that our users can perform the most advanced searches so they can find exactly what they are looking for in their data, regardless of what it is. But we have gone even further by introducing the new Search Mode. This enables you to access all these capabilities quickly and effortlessly in a very easy to use Google-like interface.
YOSE Analytics Engine 2.0
Regardless of whether you work with investigations involving organized crime, IP records, telephone data, trafficking, war crimes, or return of legal processes; the new analytics engine will allow you to extract intelligence from all of your data with a single click.
With the enhanced Link Viewer, YOSE lets you manage an unlimited number of link charts across all of your YOSE cases. You can go back and forth in history, export high-resolution diagrams and, with the hardware accelerated viewer, you can keep many entities on the screen without slowing down the app.
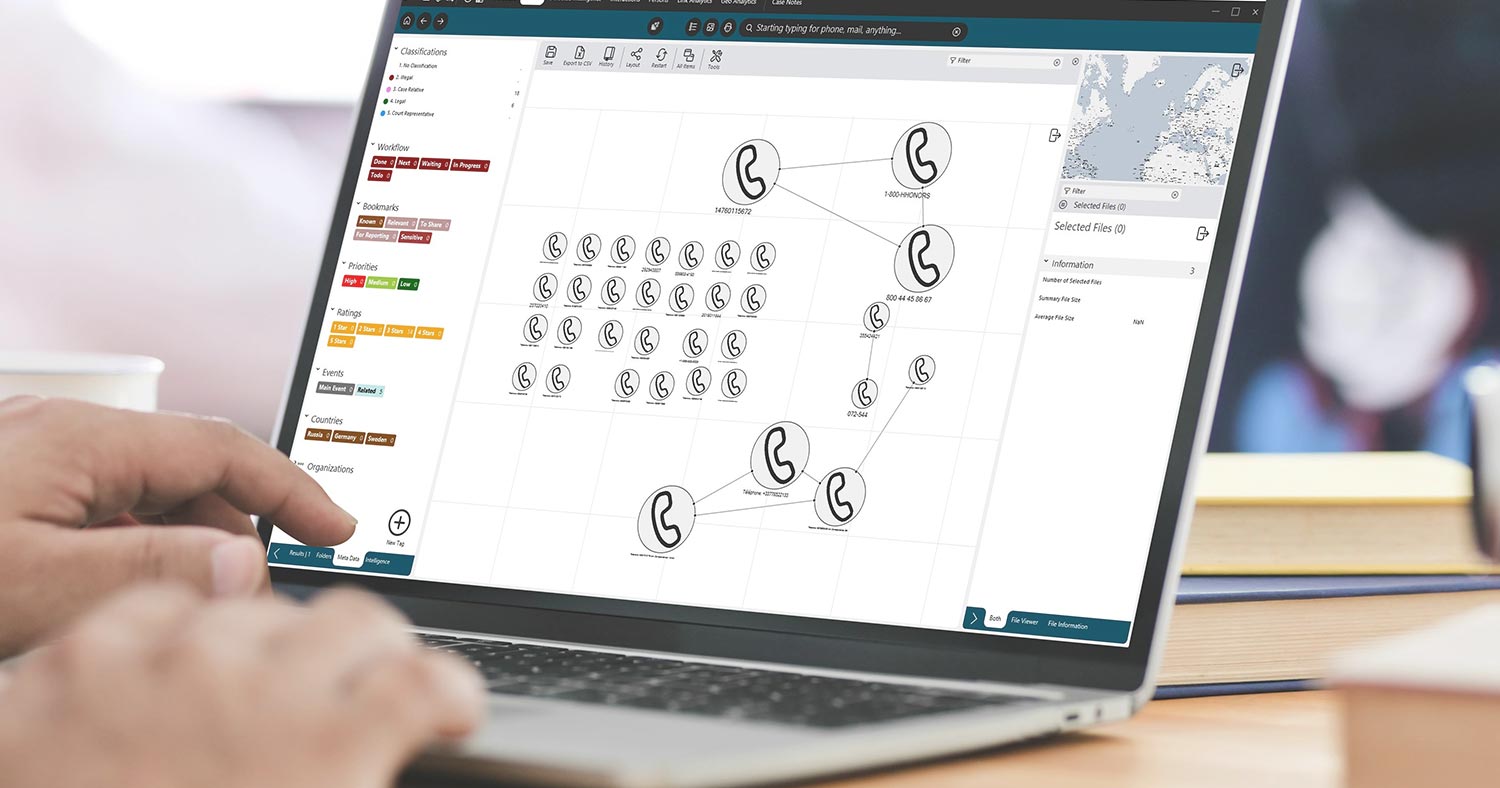
Connect the dots automatically
For those dealing with a lot of data—whether it is from Returns of Legal Process, OSINT scrapes, video material, or elsewhere—the new Connect the Dots function lets YOSE help you quickly decipher how persons, IP numbers, intelligence items, bitcoin, URLs are interconnected. Just select the ones you are interested in (persons, intelligence items, files, interactions, users, IP numbers, bitcoins, etc.) and let YOSE discover the link between them in a split second.
Find the needle in the haystack every time
With version 22.5, we have introduced several new analytical views for your data. These can be used to quickly find the most interesting starting points, and to gain a better understanding of large data sets.
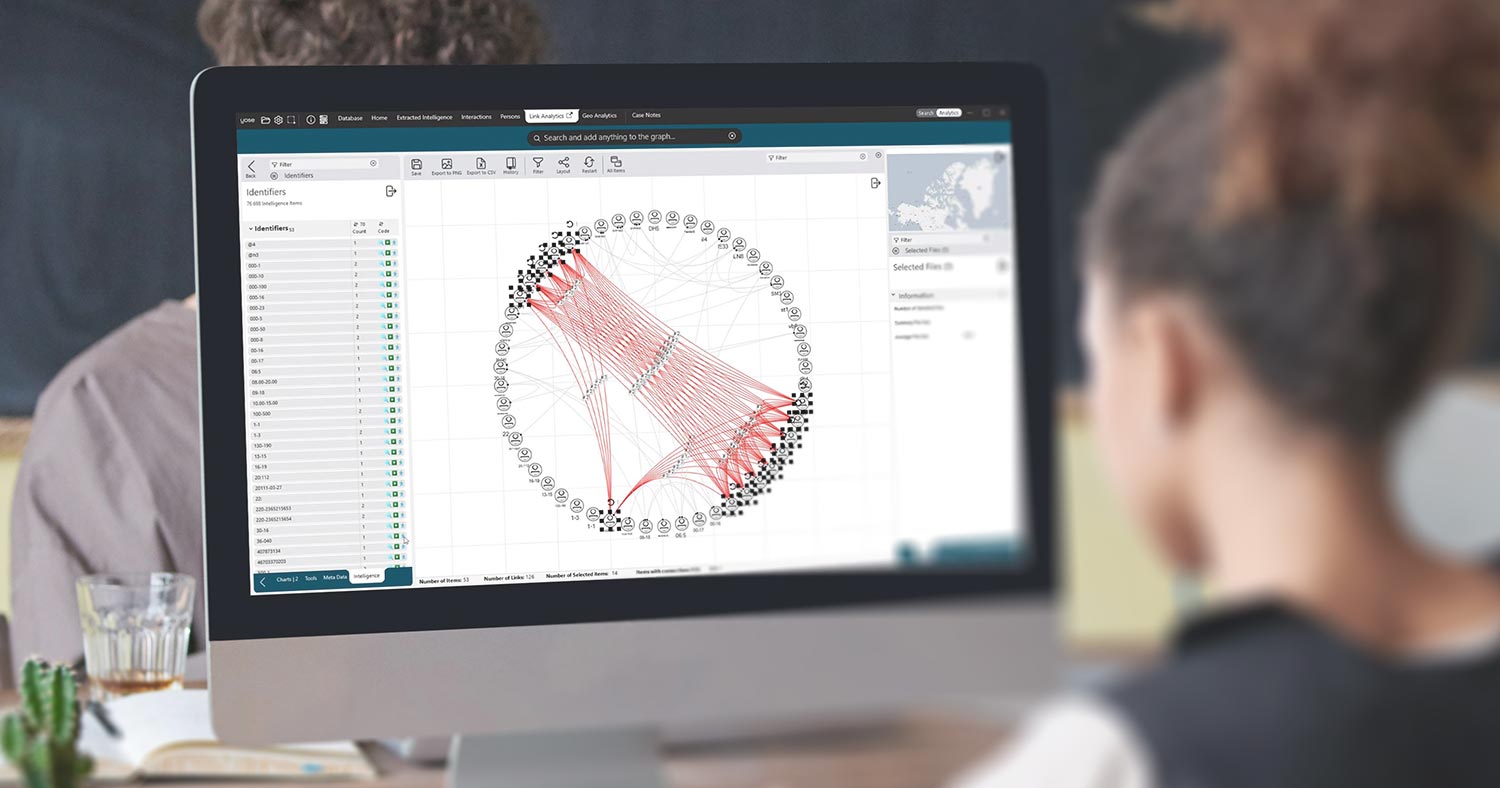
Link Visualization—a major update!
We are now reaching the top of the link analytics game, and you stand to benefit from it— whether you work with structured data, visual data, or unstructured data. And there’s more to come. You can expect us to continue innovating and developing more visualizations and analytics capabilities for you on top of the platform. Here are some of the top new link charting 2.0 features you will discover in this YOSE release:
- Save and load link charts
Keep an unlimited number of link charts connected to your YOSE server. - Share link charts
Create and share your link charts with other YOSE users who can open them and continue adding data to the charts. - Unlimited history
Keep unlimited history of each link graph, documenting every step of creation, to quickly navigate in history as the link graph evolves. - Keep multiple link charts open at the same time
Open and create multiple link charts simultaneously to compare and copy and paste between them. Select a portion of a link graph and start over in another window, making it easier to not run out of space. - Easy overview of link charts
All link charts are gathered in one place for quick and easy access. - Cut, copy and paste entities between different link charts
When copying and adding to another link chart, the connections are automatically snapped to the existing entities in the screen. - Export link charts in high resolution
Export link graphs in various resolutions, enabling you to print in high resolution on extremely large canvases. - Search and add directly to the link graph
Use the power of the YOSE search engine to search for anything and add it to the link chart. Automatically connect the dots between all items. - Filter link graph
Filter the link graph for connections and metadata. - Add whatever you want to a link chart
Enhance your link chart with anything from your dataset, such as maps, images, annotated data, video frames or other link charts. Anything you see in your YOSE dataset can be added to the link graph. - Tag items directly in the link chart
Apply metadata directly to the items on your link graph. - New layout tools for easier navigation and quick organization
- New layout mode for organizing selected entities in a square, a vertical row or horizontal row.
- Automatically set sizes of entities depending on the number of connections.
- Set line color of an entity to the classification color.
- Highlight active links when selecting an entity.
- Change icons on entity types in the link charts.
More updates you will discover in this release
- Statistical analytics
- Utilizing all new functionality for mass analytics of intelligence we have created a new category of analytics: Statistical Analytics. Combining it with the comparative analytics amounts to an incredibly powerful way to deal with large volumes of values such as CDR records, email addresses, and usernames.
- Persons updates
- We have introduced a new Merge Mode that allows you to easily merge multiple persons simultaneously. You’ll also find a new Refresh button.
- New collaborative features.
- New intelligence updates.
- New documentation updates.
- Offline translation updates.
- Geo analytics updates.
- A bunch of bug fixes and minor improvements.
For a full list of improvements in the 22.5 release, please log in to myPaliscope and read the release notes. Click here to download the latest version of YOSE. If you don’t yet have a myPaliscope account, click here to apply for one.


