
By far the greatest highlight of our latest YOSE™ release is Geo Analytics. At last beyond the beta stage, it is now fully equipped and ready to work hard for you.
With Geo Analytics, you can easily display, search, view, and analyze any data indexed in YOSE on a good-looking map—no matter where that data was found or from what source it came from.
Working in synergy with YOSE’s AI-driven search engine, Geo Analytics gives you unmatched possibilities when it comes to understanding your data from a place and time perspective. The software is so approachable, anyone can leverage its incredible superpowers to analyze multiple layers of geographical intelligence and display it in a way that is easy to understand.
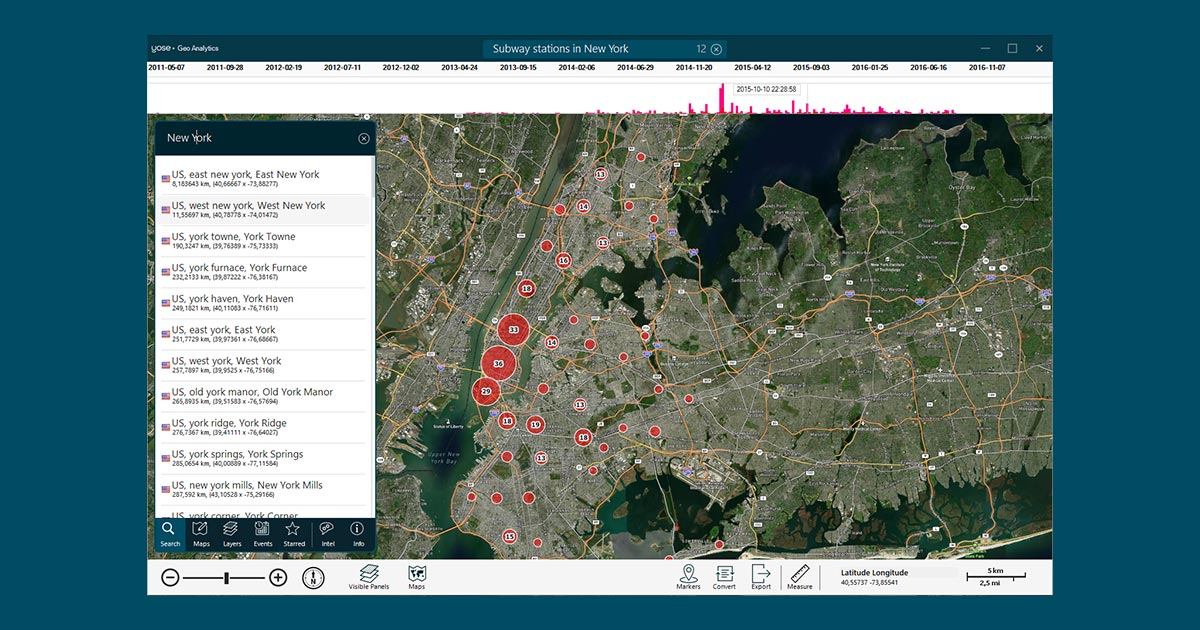
Go to a specific area, right-click, and present all files or intelligence from it. You can search for license plate numbers, persons, files with GEO data—or any data you’ve imported that is connected to a location.
LIVE WEBINAR ON SEP 29: Analyze your data with Geo Analytics
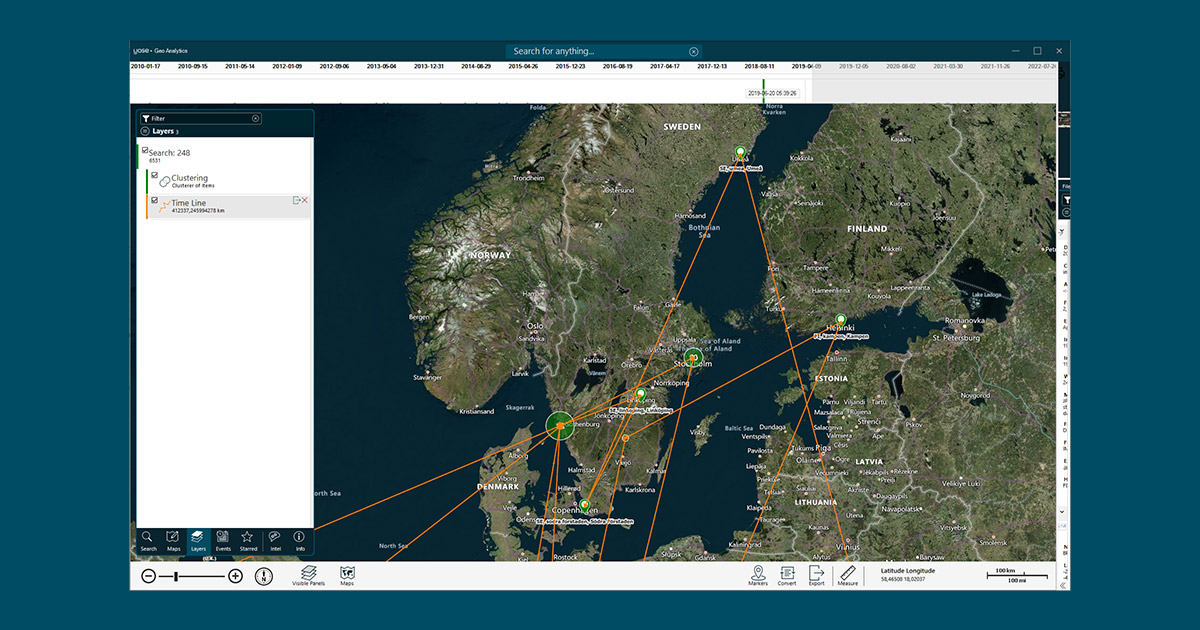
Not only can you look at your own case data, but you can also combine it with external data from other sources in order to understand it better. YOSE can combine an unlimited number of layers to help you determine whether certain events have taken place for a reason. For instance, you could see if events are taking place in close proximity to certain infrastructure.
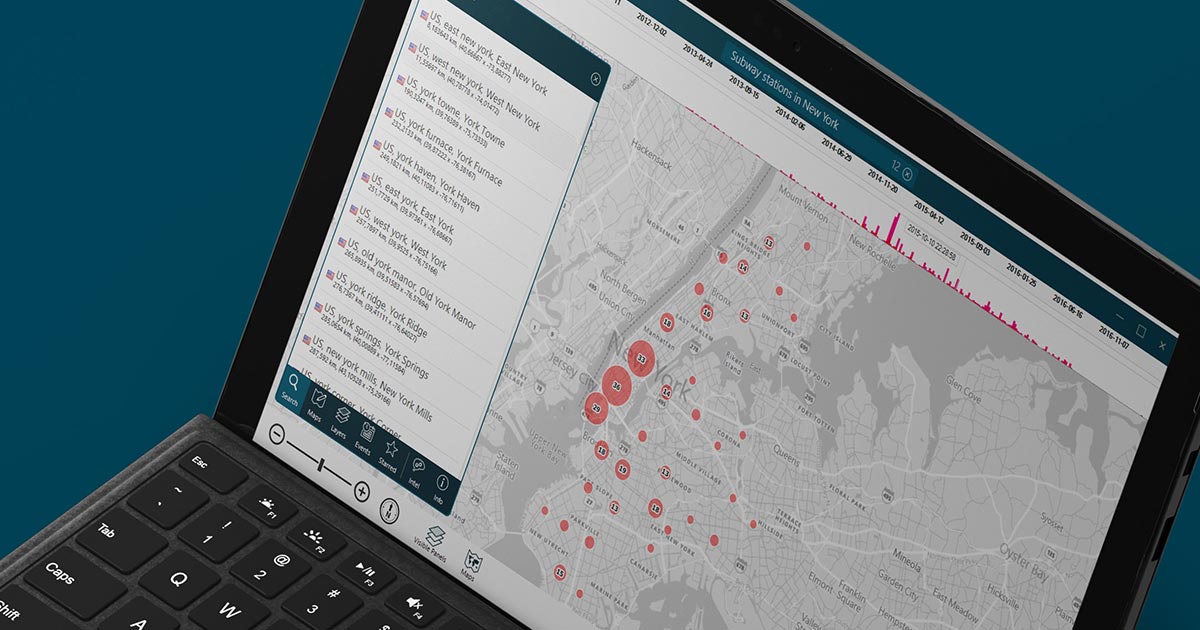
Choose from multiple map view alternatives to display the map according to your needs and requirements. If you need to connect to another map engine to view details missing from the offline map (such as satellite photos), you can switch between the map’s servers in real-time.
YOSE supports almost every type of map server, so please don’t hesitate to contact us if you want help connecting to your existing environment or a new map server.
Detect patterns and understand your data better by combining layers of information from your case with layers of external data. A layer can be a person, object, license plate, or anything from your case.
Drag a slider to discover patterns related to place and time. Don’t just ask the where question. Ask when and where to zero in on the intersection where key events have occurred.
Cluster your data to more easily reveal patterns and trends that are critical to understanding your data during Risk Terrain Modelling—especially useful when you have a lot of data.
The number of features and functions in Geo Analytics are massive, and we’ve only covered a few of them. With Geo Analytics, you can also:
In addition to Geo Analytics, you will also find a number of other great features in this release focused optimizing YOSE’s search capabilities—from Fuzzy Search to better facial recognition. To learn about them, read: “Four new features that will take intelligence operations to a new level.”
With this release, we have also taken the opportunity to give the entire YOSE software a real performance boost. Bugs have been crushed and the interface and interactions have gained great updates as well.
For a full list of improvements in the 22.3 release, please log in to myPaliscope and read the release notes. Click here to download the latest version of YOSE.

No need to worry about evidence documentation and report formatting. Paliscope Build automates all that - keeping your cases structured, secure and easy to hand over.

Find what you are looking for with Paliscope Explore - enabling analysts and investigators to triage large amounts of data and deep dive into the findings.

Process all your data in one place, collaborate across teams, search for anything, and more.