
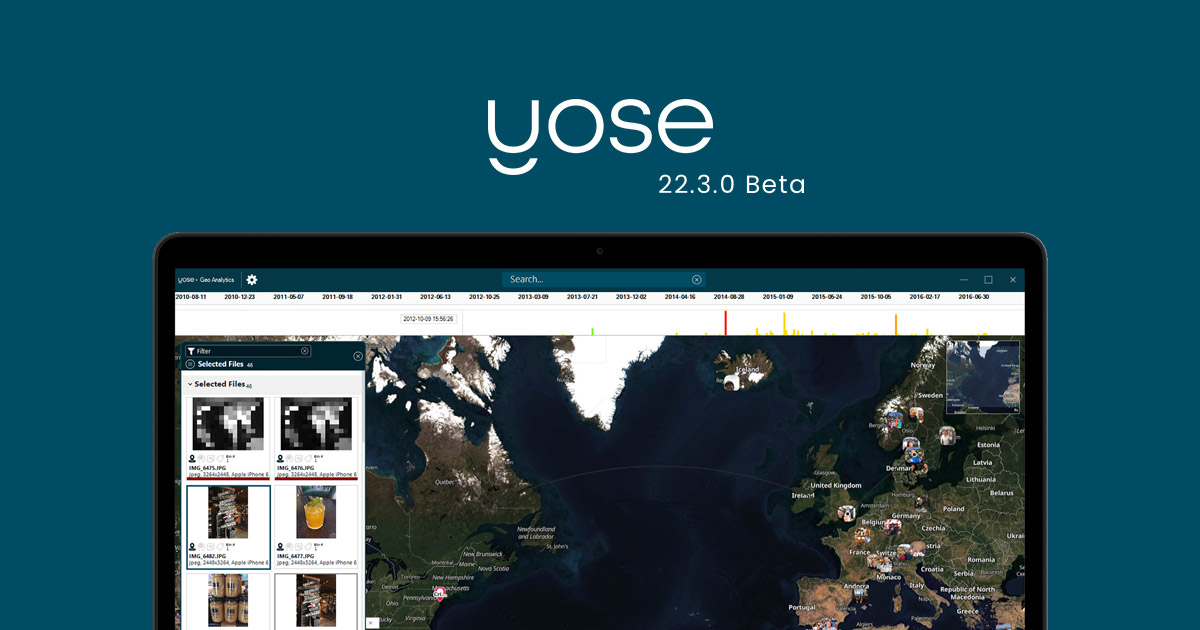
With this beta we are excited to present a new way to visualize geographical intelligence extracted in YOSE™. We call it Geo Analytics and it’s a new module the team has been working hard on for a long time. The module has also been requested by many of our users from around the world.
But wait, surely YOSE isn’t the first software to visualize data on a map—right? True. But with Geo Analytics, it’s on a whole other level.
Working in synergy with YOSE’s AI-driven search engine, Geo Analytics gives you unmatched possibilities to understand your data from a place and time perspective. The software is so approachable, that anyone can leverage its incredible superpowers to analyze multiple layers of geographical intelligence and display it in a way that is easy to understand.
We are nearly finished with the Geo Analytics module but, as a last step before its official release, we want to give our users the chance to test it out and provide valuable feedback. That’s why we are releasing a beta version, YOSE 22.3 beta + Geo Analytics.
Keep scrolling to learn more. And if you would like to try it out free for 30 days, you can sign up at the bottom of the page.
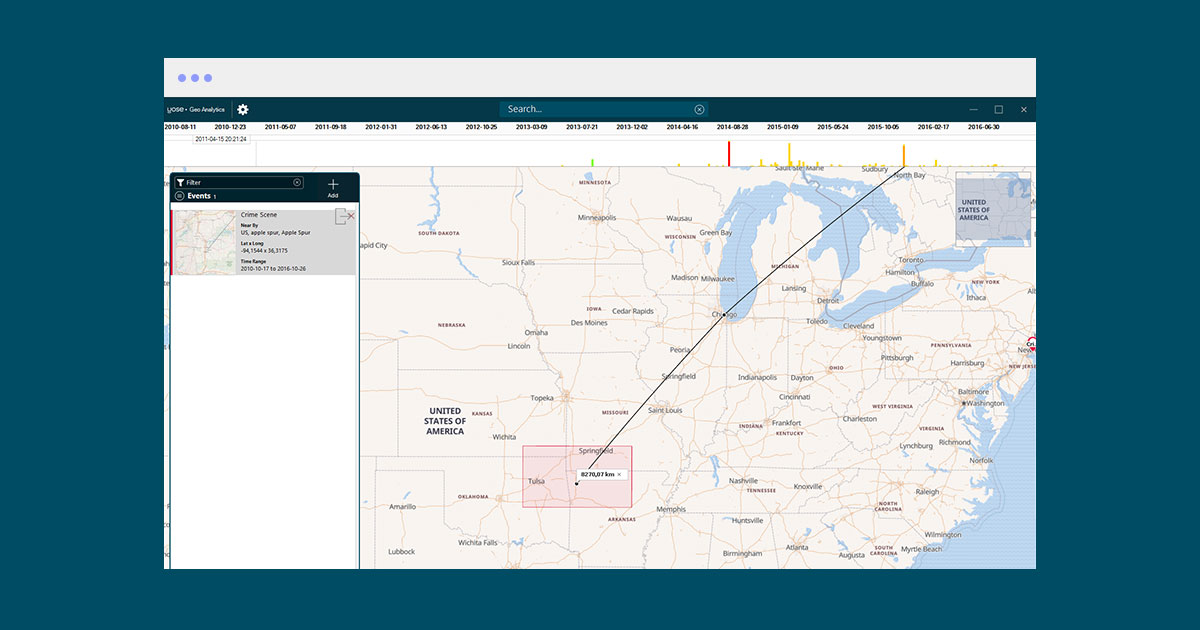
With the new YOSE Geo Analytics module you can now display, search and view anything being indexed in YOSE on a good-looking map—no matter where the data was found. When you combine this technology with the other analysis capabilities in YOSE, you end up with a highly effective solution for finding the right intelligence and driving cases forward even faster.
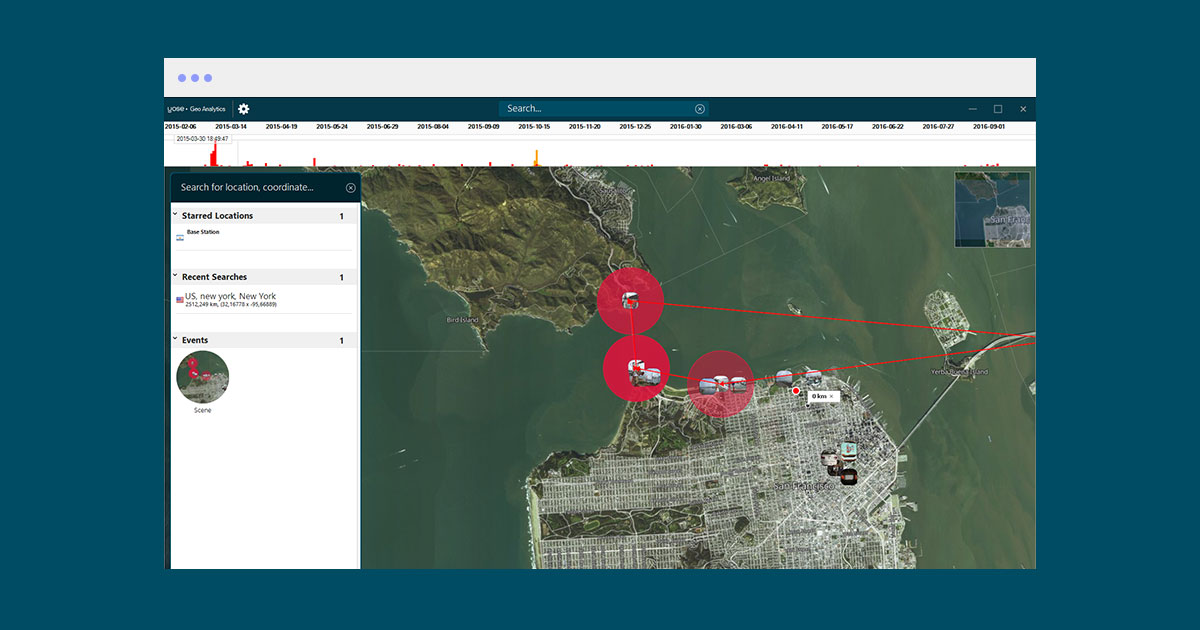
Choose any of the alternatives below to display the map according to your needs and requirements. If you need to connect to another map engine to view details missing in the offline map (such as satellite photos), you can switch between the map’s servers in real-time.
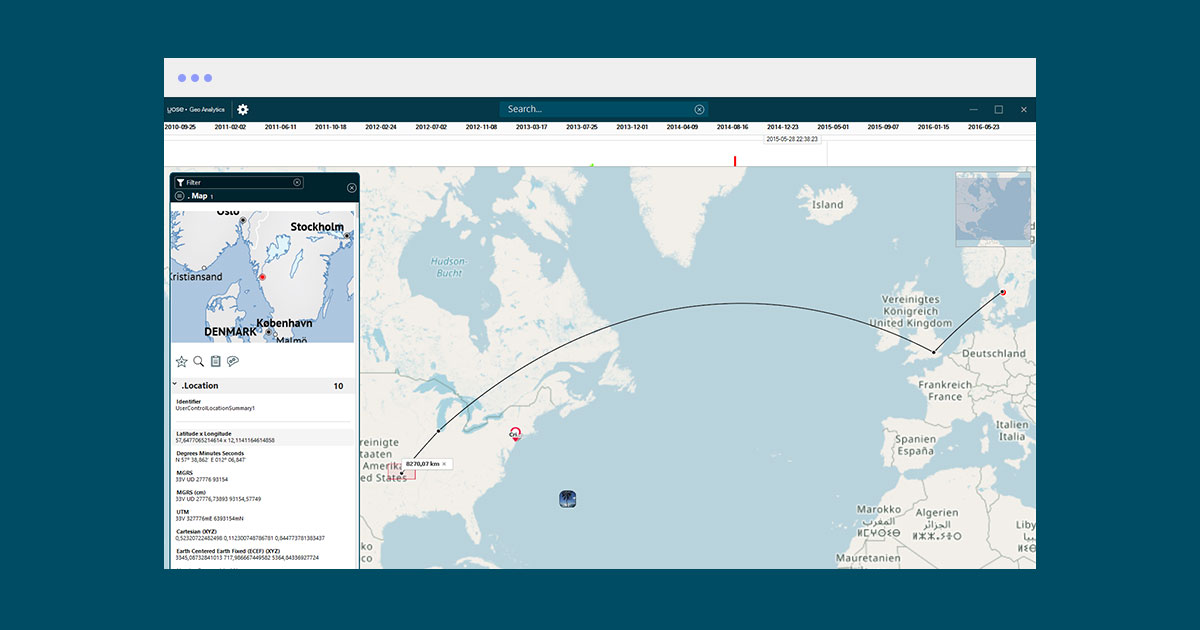
The world is available to download from Paliscope as an offline map, down to the street level. Using vector-based technologies and some new database technologies, we are able to squeeze the complete world into YOSE, only requiring 80GB for the complete map without the need for a server.
Automatically connect to an online map cluster for extremely fast access, or connect to your own map server provider if you are already subscribing to such a service (like Mapbox or Bing Maps).
Connect YOSE to an internal map tile server.
Use unlimited layers to view all intelligence on the same map. Combine all kinds of data sources on the same map to spot correlations.
Ingest a file that contains IP numbers, and YOSE will find them all and convert them into locations. Cross that with a return from a legal process, such as Facebook or Instagram data and a list of financial transactions with a folder of images with GPS data.
Import CSV files (IP, custom).
Bulk-convert or import coordinates, IP numbers, and locations.
Measure Distance or Area on the map as easy as drawing with the mouse.
Draw on the map to create polygons, circles, rectangles, etc.
Convert geo coordinates.
Set the format to be displayed on geo coordinates (own label).
Our team has not been lazy. In addition to bringing Geo Analytics to life, we’ve given the entire software a real performance boost. Bugs have been crushed and several new features have been introduced. For example:
This form is displayed on Contact Us Page
"*" indicates required fields
For a full list of improvements in the 22.3.0 beta release, please log in to myPaliscope and read the release notes. If you would like to try it out free for 30 days, you can sign up below.

No need to worry about evidence documentation and report formatting. Paliscope Build automates all that - keeping your cases structured, secure and easy to hand over.

Find what you are looking for with Paliscope Explore - enabling analysts and investigators to triage large amounts of data and deep dive into the findings.

Process all your data in one place, collaborate across teams, search for anything, and more.