Creating an OSINT report – how hard can it be?
Well, pretty hard as it turns out. Unless you’ve got Paliscope that is.
You’d think that once you’ve finished an investigation, your reports would simply generate themselves. They won’t. Actually, that’s not entirely true. They will if someone’s done a huge amount of complex coding for you. Which we have! And it’s going to save you loads of time.
With the Paliscope report function, you don’t have to worry about designing your own reports from scratch. All that copying and pasting, image resizing, paginating and messing about with a table of contents. It can all get a bit tricky. Not to mention time-consuming. But Paliscope does it all for you.
Why Paliscope reports are so great
We discovered that one of the biggest problems people face when designing OSINT reports is being able to produce a high-quality PDF. So we made that one of our top priorities when we began developing Paliscope.
Here’s just seven of the handy features that we’ve managed to incorporate:
1. Automatic table of contents – no fuss
Knowing how many pages your report will have and what will go where isn’t always obvious when you begin your report. But people reading it want to know stuff like that. And that’s why Paliscope automatically generates a table of contents for you.
2. Intuitive page breaks – actually harder than it sounds
Adding page breaks sounds easy. And it can be, but it usually isn’t. That’s because you have to think about things like content flow (how it reads) and visual esthetics (how it looks). The Paliscope report templates sort all that out for you. They even know when to add a “continued” footer to the page. Clever, eh?
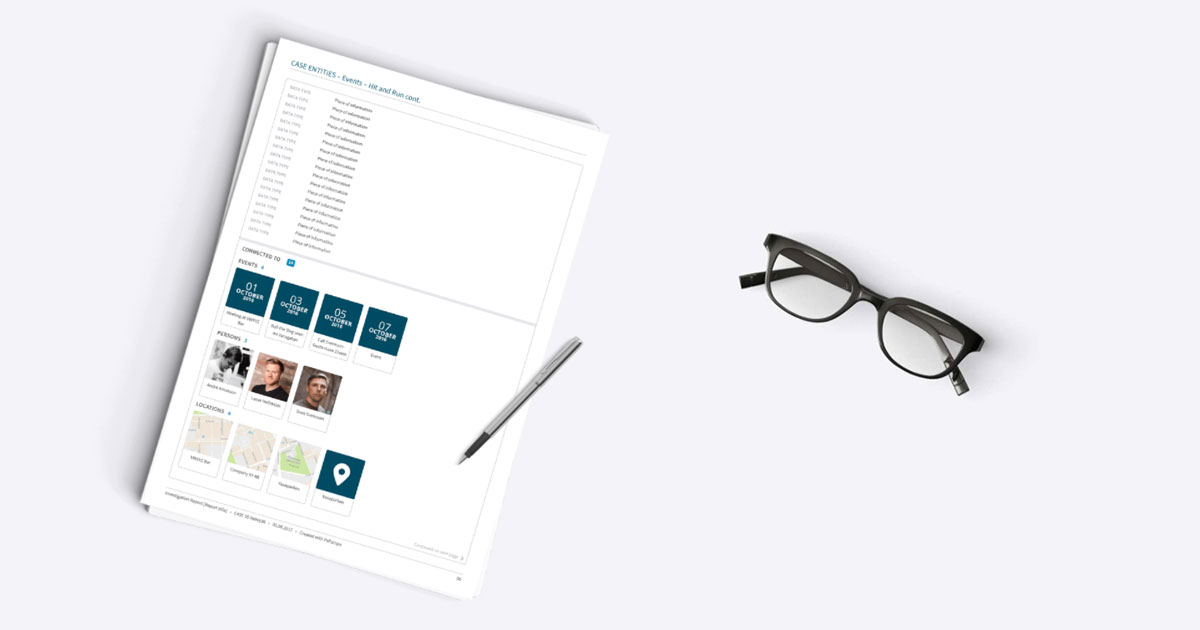
3. Straightforward handling of images and screenshots
Adding images and screenshots to a report can be time-consuming and frustrating. Partly because they usually have to be resized (while preserving the aspect ratio), but also because they rarely fit onto a single page. This means the images must be cropped or split (in the right place), and you have to be careful about how much of the image will appear on the following pages. And if you want to add anything in between, then everything has to be cropped all over again. Luckily… yes, you guessed it, Paliscope fixes that for you.
4. Simple navigation – no more scrolling
Automatically generated hyperlinks (clickable shortcuts) conveniently located throughout each report make it much easier to find your way around. So not only can you skip to a specific element in your report from the table of contents (and back again), but you can also surf about between related information from within the actual report. Gone are the days of endless scrolling back and forth trying to locate information. Simply click and you’re there.
5. Stylish and straightforward – easily digestible content
Paliscope reports are stylish, uncluttered and modern, as well as being straightforward and easy to follow. They are based on specially-designed templates, in other words, you can generate several different report designs using the same data. Admittedly there’s only one template at the moment, but we’re working on more. We’ll keep you posted.
6. Sharing your report – no problem
As well as being able to easily share your report in PDF format, you can also export it as a HTML version directly from Paliscope. That way you can share it on other platforms, such as Sharepoint, without losing any of the functionalities or formatting.
7. You decide what you want to put in your report
You can choose to add absolutely everything you’ve collected in Paliscope to your report, or just include a selection. It’s completely up to you. The reports are fully customizable, because only you know what’s relevant and what’s not.
Find out more about Paliscope reports and all the other features we’ve added.


