NEW RELEASE: 20.1.0
Connect the dots and discover relationships with Paliscope’s new Visualize mode
You’ve spent a good amount of time building your case and have succeeded in collecting a pile of information. Now, you need to create some context and understand how it all links together.
The manual process of checking each item in a spreadsheet and then attempting to connect the dots is tedious and difficult work. Especially considering that the human brain is naturally geared towards spotting data patterns and trends when it is mapped out and visualized.
This is where having a link analysis tool like Paliscope’s new Visualize mode becomes extremely helpful.
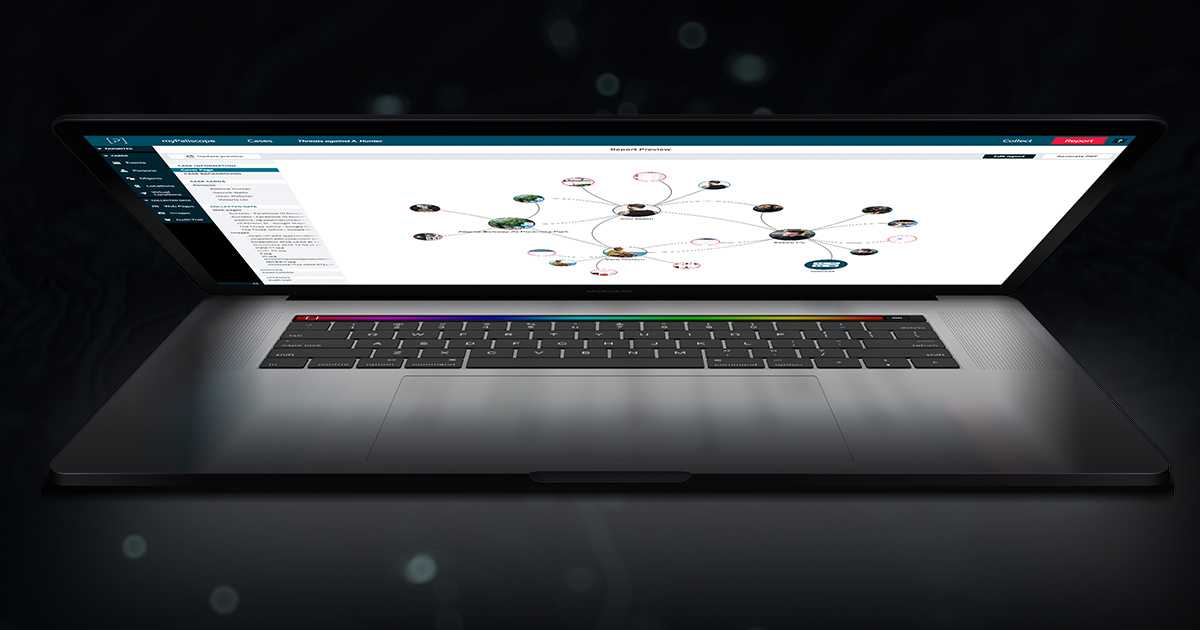
Link analysis provides an instant overview of your case
Using Paliscope’s new link analysis mode, simply called Visualize, you can connect the dots and visualize all the components of your case in a single view.
Link analysis can be used in all sorts of cases, offering a visual representation of the connections you have made between your data and identified targets. But there’s more—link analysis can also be used to illustrate your investigative workflow. It gives you an overview of the different steps you have taken, where you started, how the case has developed, and lets you to easily identify any gaps or loose ends in your research.
The link chart generated in Visualize mode is also a useful addition to reports, allowing you to give other interested parties an instant overview of case progress in a format that’s easy to understand.
All in all, visualizing information and connections within a gathered dataset allows you to fully understand what you are dealing with. It will save you time, make it easier to process information, and allow you to discover new connections and, potentially, even new ways to move forward in your investigation.
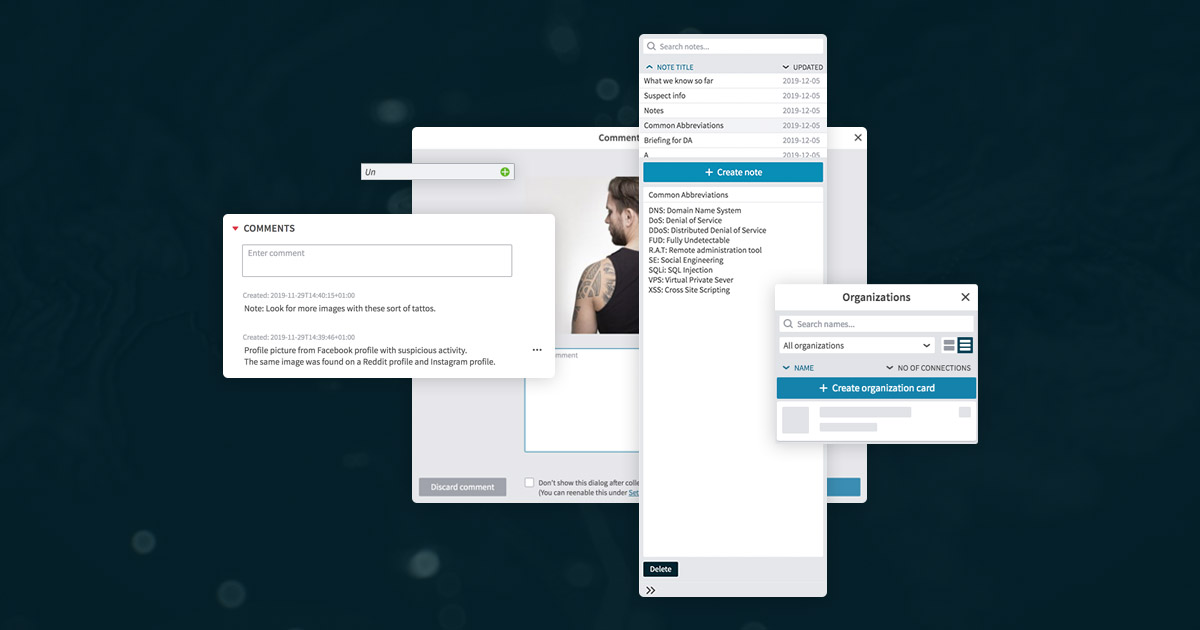
Take notes and organize cards your way
In addition to the new Visualize mode in Paliscope Discovry, we have added a new built-in notepad. This makes it easier for you to quickly take notes throughout the research process without interrupting your flow—for example, writing down new questions that need to be answered. The built-in notepad can be accessed in Collect mode and is displayed as a column on the righthand side.
Another new function added in this release is a new card type called Organizations. Based on your input, we understand that this new card type will be useful in a lot of investigations. We have also made it possible specify your own category in each card—for example, to describe who a person is and who or what they are related to.


